If you look at the charts long enough, you start seeing patterns everywhere. You have to be careful because spotting a pattern is much easier than dealing with your mindset, psychology, and risk management. There is a progression that we traders need to run through to make everything come together. Spotting patterns is a good way to start getting some confidence in the market. Once you get the hang of these formations, you stop making wild guesses and start actually reading the market.
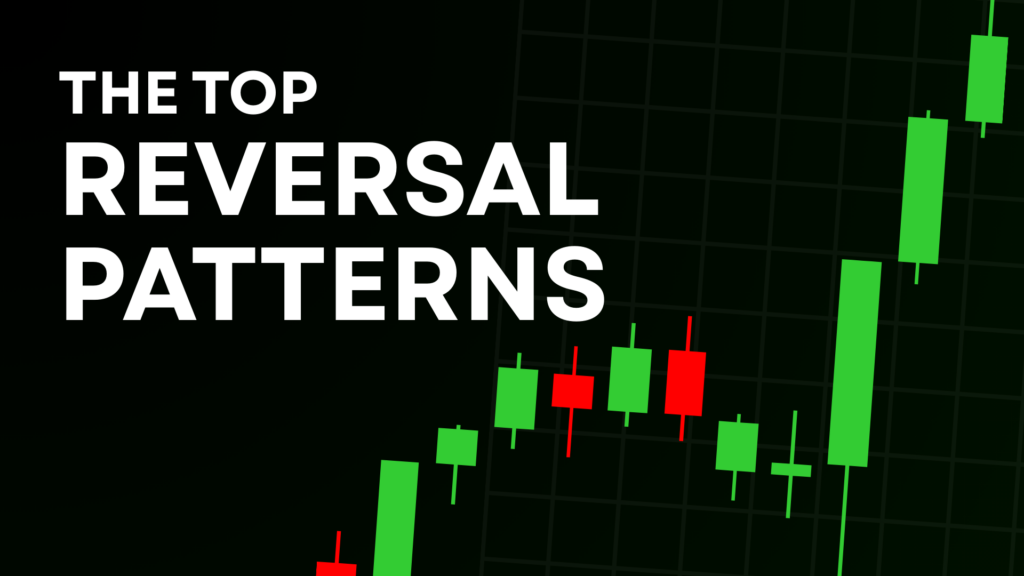
Reversal candlestick patterns are the visual clues that a trend is about to change direction. A downtrend might be losing steam and starting to run out of puff. An uptrend could be peaking and about to top out. They don’t guarantee the future, nothing ever does – but when you use them in combination with a bit of context, they give you a real edge.
Now, let’s get down to the nitty-gritty and break down the top 7 ones.
1. The Hammer
The Hammer is one of the classic bullish reversal candlestick patterns, and it tends to show up when a downtrend is running out of legs. The body is small, right at the top of the candle and the wick at the bottom is nice and long – at least twice as long as the body.
When you see this pattern pop up, it usually means there’s some pretty optimistic sentiment going on and people are getting a bit more willing to buy in at key support levels – especially if there’s some decent volume coming in and you’re looking at it from a few different timeframes.
What it’s really telling you is that sellers pushed the price down pretty hard, but the buyers were right back in there, trying to get the price back up to where it started – which is a pretty good sign that the price is about to turn round.
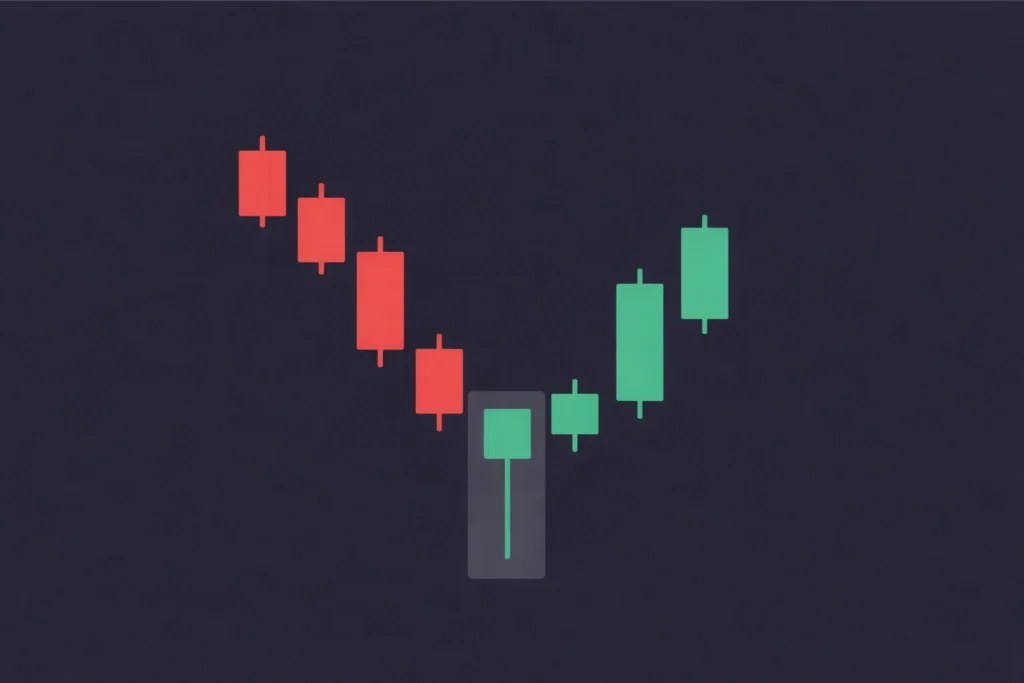
When this pattern stands on its own, its success rate is around 40-60% – but that shoots up pretty quickly when it appears near a support level with some decent volume behind it.
2. The Inverted Hammer
The Inverted Hammer is the mirror image of the Hammer and it suggests a downside reversal from an uptrend. Same kind of context: end of a downtrend – but with the body and wick the other way round. The small body is near the bottom, and the wick reaches right up to the top.
It’s a sign that buyers are starting to lose their grip, but they’re not giving up – yet. It’s a bit of a mixed message, to be honest.
This sort of pattern tends to show up when there’s some uncertainty among traders at the end of a downtrend – and it’s a signal that the trend might be about to change. Even if it does happen to follow through with a confirmation candle the next day, it’s a good sign that the market might be getting ready to turn round.
Historically, this pattern has a success rate of around 67%, which isn’t bad at all.
3. Bullish Engulfing
The Bullish Engulfing is one of the most well-known bullish reversal candlestick patterns, and it’s also a pretty common one.
It’s a two-candle pattern. First you get a small bearish candle, and then a big, long bullish candle that engulfs the whole of the first one.
The key thing is that the second candle should close above the high of the first one – which tells you that the buyers are really getting on board and the trend might be about to turn round. The message is pretty clear: the buyers have finally taken control.
It’s a two-candle pattern. First, you get a small bearish candle, and then a big, long bullish candle that engulfs the whole of the first one. The key thing is that the second candle should close above the high of the first one, which tells you that the buyers are really getting on board and the trend might be about to turn round. The message is pretty clear: the buyers have finally taken control.
It’s a pretty reliable pattern, with a success rate of around 63%, which is pretty good when you consider that most patterns don’t have a huge success rate.
4. Bearish Engulfing
The Bearish Engulfing is a bearish reversal pattern, and it’s one of the most common patterns that traders use to identify potential trend changes.
It tends to appear at the top of an uptrend, when a small bullish candle is completely swatted aside by a bigger bearish candle.
The key thing is that the bearish candle closes below the low of the bullish candle, which tells you that the sellers are getting pretty aggressive.
When you see this pattern pop up, it’s a sign that the trend might be about to turn bearish – especially if it’s near a resistance level and there’s some decent volume behind it.
Sellers are getting the upper hand, and this pattern tends to be a bit more reliable than its bullish counterpart, with a reported success rate of around 79%.
5. Morning Star
The Morning Star is one of the classic bullish reversal patterns, and it tends to show up after a downtrend has run its course. It’s a bit of a tricky one, but basically…:
- First candle: A big, bearish candle with a long wick (sellers are in control)
- Second candle: A small, indecisive candle that gapped down (momentum is stalling)
- Third candle: A strong bullish candle that closes more than half way into the body of the first candle, showing that the buyers are really getting on board
When you see this pattern pop up, especially near a major support zone with some rising volume behind it, it’s a pretty good sign that the market is about to turn. Historically, the Morning Star has a success rate of 60-75%, which is pretty respectable.
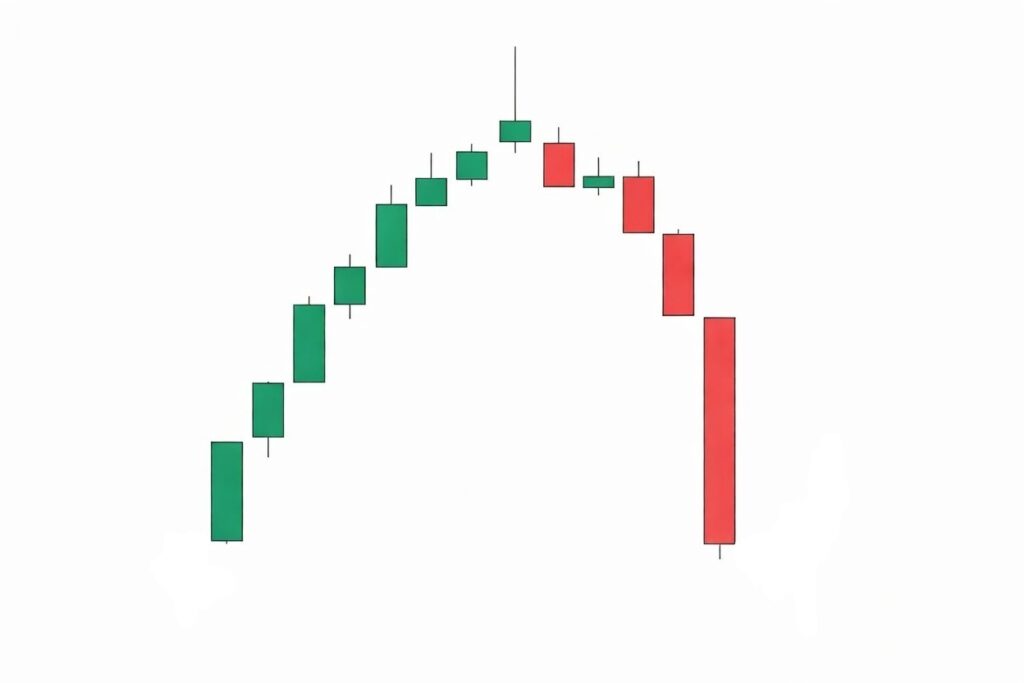
6. Evening Star
The Evening Star is part of the bearish reversal patterns, and it tends to show up after a big uptrend has ended. Like the Morning Star, but with the wicks and bodies the other way round. It’s a sign that the buyers are getting a bit tired and losing their grip on the trend. It’s a bit of a tricky one, but if it shows up near a major resistance level with some decent volume behind it, it’s a good sign that the trend might be about to turn bearish.
The evening star pattern is a rather ominous-looking bearish reversal that signals the end of the current trend, usually after a long run up.
It pops up on three candlesticks: the first one being the one before, a big strong bullish candle thats really rallying the trend; the second is a tiny candle that looks like its lost all steam – often an indication that upward momentum is starting to sputter; and the third is a long bearish candle that closes deep into the body of the first candle – this shows us that bearish force has taken control and we might be seeing the start of a bearish reversal.
You’ll see the evening star most reliably on your daily charts, especially when there is some serious volume behind that third candle. Confirmation of the reversal can be strengthened by looking at negative divergence on your technical indicators like MACD or RSI – that just spells out weakening momentum. The success rate with this one hovers around a pretty decent 70%.
7. Shooting Star
The shooting star pattern is a very particular looking single candle bearish formation that you’ll often spot at the peak of a long running uptrend, usually right at a resistance level.
This pattern appears when the one before it was a bullish candle, followed by a candle with a tiny real body near the session low and a long upper shadow that is at least twice the length of the body.
The long upper shadow and the fact it reaches up into the upper part of the candle indicate that buyers were really pushing prices higher during the session, but sellers came in and took over and pushed the price right back down before the close, showing indecision in the market.
The shooting star can signal potential bearish reversals, but always wait for a bearish candle to follow it up and confirm.
Using Reversal Patterns with Other Tools
Reversal candlestick patterns are pretty powerful on their own, but they really come into their own when you pair them with other types of technical indicators. Think of it like building a picture – each piece of evidence adds to your trading decision and makes it more confident.
For example, if you spot a bullish engulfing pattern on your charts thats a very good start – it’s like you got a solid foundation to build on. But if that same pattern is breaking above a key moving average and the RSI is showing oversold conditions, you’ve got a much stronger bullish reversal signal. This combination tells you that not only is the price movement changing, but also the market sentiment and momentum.
Bollinger Bands can add another layer of depth – if a reversal candle forms right on the lower band, it’s usually a sign that selling pressure has gone too far and it’s time for the market to bounce back up. By using these technical indicators in conjunction with your favorite reversal pattern,s you filter out the weaker setups and focus on the high probability trades.
In short dont treat reversal patterns as standalone signals – use them as part of a bigger trading strategy and make sure you combine what you see on the chart with other tools. This way, you can spot genuine trend reversals and avoid getting caught out by false moves.
How to Use These Patterns Effectively
Recognising a pattern is just the start. Here’s what actually makes them reliable:
- Location is everything : Patterns forming near key support or resistance levels carry way more weight than ones that form in the middle of nowhere.
- Volume is king : A reversal candle on high volume tells you the buyers or sellers are really serious
- Use trading tools to your advantage : Combine these patterns with tools like trend lines and other forms of candlestick analysis to confirm the reversal signals and get a better feel for market conditions.
- Distinguish between the different types : Make sure you can tell the difference between continuation patterns and reversal candlestick patterns as each one gives you different trading signals.
- Look for the same pattern in different places : Spotting the same pattern across different timeframes or market conditions can really add weight to the validity of a price reversal signal.
- Study the different categories : Expand your knowledge by checking out other reversal patterns, bearish candlestick patterns, bullish patterns and bearish patterns to improve your ability to spot price reversals.
- Use indicators to filter out the noise : Combine these patterns with tools like RSI or moving averages to get rid of the false signals.
- Always manage your risk : Keep your stop loss just beyond the pattern’s extreme point, and never risk more than 2% of your account on a single trade.
Taking it to the Next Level as a Trader
Learning these patterns is not a one-off event but a process – you will spot them wrong sometimes – you will be unsure of yourself – it’s all part of it.
Its the traders who keep going back and reviewing their charts and building on what they learn who improve. Start watching for these seven patterns on your charts this week – just observe, no pressure to trade. The more you see them, the faster your pattern recognition will develop.
Thats how you start to get a feel for the language of the market.