

When I first started learning about trading, I remember the learning curve was crazy huge. I took time, and then when I moved to a different asset, oh man. You’ve got to start all over again. What a pain in the ass.
Trading is hard enough without having to learn a completely new language. You will want to quit when you encounter a wall of jargon that makes no sense. You will want to smash your keyboard when you enter the wrong order type because you didn’t fully grasp the difference between a limit and a market order.
We need a clear path forward. To find consistency in the markets, you must first understand the foundation. Knowing the language of the markets gives you the clarity to execute your strategy with confidence. Mastering day trading terminology, trading terminology, and trading vocabulary is essential for effective communication, risk management, and trading success.
I put together this day trading glossary to help you navigate your journey. Here are 50 essential terms every aspiring trader needs to know.
The Absolute Basics
We all have to start somewhere. These foundational terms describe the market’s core participants, actions, and assets.
- Ask Price: The lowest price a seller is willing to accept for a security.
- Bid Price: The highest price a buyer is willing to pay.
- Spread (Bid-Ask Spread): The difference between the bid and the ask price. Tight spreads usually indicate a highly liquid market.
- Bull: A trader who believes the market, or a particular stock, will go up.
- Bear: A trader who believes the market or a specific asset will go down.
- Blue Chip: A large, well-established, and financially sound company.
- Day Trading: Buying and selling the same security or futures contract on the same day to capture short-term price movements.
- Swing Trading: Holding a position for several days or weeks to capture a larger price move.
- Going Flat: Closing all your open positions so you have no exposure to the market.
- Ticker: The unique series of letters representing a specific stock or asset on an exchange (like AAPL for Apple).
- Financial Instruments: Assets such as stocks, options, or commodities that are traded in the market.
- Float: The number of shares available for the public to trade. Low float stocks can be highly volatile.
- Volume: The total number of shares or contracts traded during a specific timeframe.
- Market Participants: Individuals or entities involved in buying and selling in the financial markets, whose actions influence price movements.
- Volatility: The rate and magnitude of price changes. High volatility means prices are moving wildly.
Order Types and Execution
How you enter and exit the market matters. A slight misunderstanding here can cost you dearly.
- Market Order: An order to buy or sell immediately at the current best available price.
- Limit Order: An order to buy or sell at a specified price or better. You control the price, but execution is not guaranteed since the order will only execute at your predetermined price or better.
- Stop-Loss Order: An order placed to sell an asset when it reaches a certain price, designed to limit your potential losses.
- Slippage: The difference between the expected price of a trade and the price at which the trade actually executes.
- Long: Buying an asset with the expectation that its price will rise.
- Short Selling: Selling shares that have been borrowed, with the intention of buying them back at a lower price if the market moves in your favor, allowing you to pocket the difference.
- Scalping: A fast-paced trading strategy aiming to profit from very small price changes.
- Pre-Market / After-Hours: Trading sessions that occur before the official market open and after the official close.
Market Data and Order Flow
Reading the tape is an art. These terms will help you understand where the buyers and sellers are hiding.
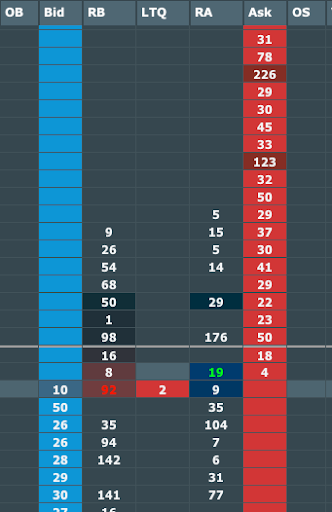
- Depth of Market (DOM): Also known as the price ladder. It displays the number of open buy and sell orders at different prices.
- Level II: A data feed that provides a deeper look into the market book, showing alternative bids and offers away from the inside quote.
- NBBO (National Best Bid and Offer): A consolidated quote calculated and disseminated by the SIP (Security Information Processor). It guarantees you see the highest bid and lowest ask price across all US exchanges.
- Order Flow: The real-time stream of buying and selling volume. Tracking order flow helps you see who is currently in control of the market.
- Heatmap: A visual representation of the limit order book. Platforms like Bookmap use color scales to show where heavy liquidity is resting.
- Liquidity: How easily an asset can be bought or sold without drastically affecting its price.
- Market Maker: An entity, often a large institution, that provides liquidity by posting both bid and ask prices. Market makers facilitate trade execution, create the spread, and help connect traders to the broader liquidity pool.
- Thinly Traded Stocks: Stocks with low trading volume and liquidity. These often have wider bid-ask spreads and can experience more volatile price movements, making them riskier but sometimes attractive to day traders.
- VWAP (Volume Weighted Average Price): A trading benchmark calculated by adding up the dollars traded for every transaction and dividing by the total shares traded. Institutions use this constantly.
Account and Compliance Rules
Trading involves strict regulatory frameworks. Ignoring these rules can freeze your account.
- Margin Account: A brokerage account where the broker lends you cash to purchase securities. It allows for borrowing money from the broker to increase your trading capacity, which increases your buying power but also your risk.
- Initial Margin: According to Regulation T of the Federal Reserve, you may borrow up to 50 percent of the purchase price of equity securities.
- Maintenance Margin: The minimum amount of equity you must keep in your margin account at all times (FINRA requires at least 25%, though some brokers demand more).
- Margin Call: A broker’s demand that you deposit additional cash or securities to bring your account up to the maintenance requirement. If you fail to do so, they can liquidate your positions without notice.
- Leverage: Using borrowed capital to increase the potential return of an investment. Opening a leveraged position means using borrowed funds to amplify both potential gains and losses.
- Pattern Day Trader (PDT): A FINRA designation for someone who executes four or more day trades within five business days in a margin account.
- PDT Rule Minimum Equity: If you are flagged as a Pattern Day Trader, you must maintain a minimum account balance of $25,000 in your account at all times to continue day trading. This minimum account balance requirement is enforced to ensure traders have sufficient capital and to comply with regulatory rules.
- Profit and Loss (P/L): A running tally of how much money you have made or lost.
- Drawdown: The peak-to-trough decline of your account balance during a specific period.
Technical Analysis and Charting
Charts tell the historical story of price action. Learning these terms helps you anticipate the next chapter.
- Candlestick: A type of price chart showing the open, high, low, and close for a specific time period.
- Chart Patterns: Recurring formations on price charts that signal potential trend reversals or continuations, helping traders make informed decisions. Examples include head-and-shoulders, flags, and pennants.
- Doji: A candlestick pattern where the opening and closing prices are nearly identical, signaling market indecision.
- Support: A price level where a downtrend tends to pause due to a concentration of buying interest.
- Resistance: A price level where an uptrend tends to pause due to a wall of selling pressure.
- Breakout: When the price moves forcefully above a resistance level or below a support level on increased volume.
- Pullback: A temporary reversal in the prevailing trend. Pullbacks are often viewed as buying opportunities in an uptrend.
- Moving Average: A technical indicator that smoothes out price data to create a single flowing line, helping you identify the trend direction.
- Gap: An empty space on a chart where the price moved sharply up or down with no trading in between, usually occurring overnight.
- Relative Strength Index (RSI): A momentum oscillator that measures the speed and change of price movements, often used to spot overbought or oversold conditions.
- MACD (Moving Average Convergence Divergence): A trend-following momentum indicator that shows the relationship between two moving averages of a security’s price.
- Average True Range: A technical indicator that measures market volatility by calculating the average range between high and low prices over a set period. It helps traders adjust stop-loss placement, position sizing, and risk management strategies.
- Fundamental Analysis: The evaluation of a stock’s intrinsic value based on earnings, economic data, and company-specific factors. It is used to assess longer-term trends and understand how fundamental data can impact short-term trading decisions.
- Technical Indicators: Tools used in technical analysis to interpret price data, volume, and open interest. They play a crucial role in predicting price movements and identifying future price movements, helping traders spot trends, reversals, and trading opportunities.
Trading Simulation
Trading simulation is an essential stepping stone for every aspiring day trader. Before risking your own money in the fast-paced world of financial markets, a simulator lets you practice your trading strategies in a risk-free environment. These platforms replicate real-market conditions, giving you access to real-time market data and allowing you to experiment with different trading terms, technical analysis techniques, and margin trading scenarios.
With a trading simulator, you can test your understanding of support and resistance levels, observe how price movements unfold, and refine your ability to predict market trends. Simulators often include customizable trading parameters and detailed performance metrics, so you can track your progress and identify areas for improvement. Practicing in a simulated environment helps you develop a solid trading plan, build confidence in your trading style, and strengthen your trading psychology—all without the pressure of real financial risk.
By dedicating time to simulation, day traders can master the mechanics of entering and exiting trades, manage risk more effectively, and gain the discipline needed to succeed in live markets. Whether you’re learning to spot resistance levels or perfecting your technical analysis, trading simulation is the safest way to turn knowledge into consistent results.
Trading Technology
In today’s markets, trading technology is the backbone of every successful day trader’s toolkit.
From advanced trading platforms to powerful technical indicators, the right technology can make all the difference in analyzing price movements and executing trades with precision.
Modern trading platforms offer real-time market data, intuitive charting tools, and seamless order execution, allowing you to react quickly to price volatility and shifting market sentiment.
Technical indicators—such as moving averages and the relative strength index—help you identify trends, gauge momentum, and make informed trading decisions.
Market data feeds provide up-to-the-minute information on trading volume, price action, and overall market sentiment, giving you a competitive edge.
Many traders also leverage technology to automate their trading strategies, monitor open positions, and adapt to changing market conditions.
By harnessing the power of trading technology, day traders can stay ahead of the curve, manage risk, and capitalize on short term price movements with greater confidence and efficiency.
Trading Plan
A trading plan is your personal roadmap to navigating the ups and downs of the stock market. It’s a written document that outlines your trading goals, risk tolerance, and the specific trading strategies you’ll use to achieve consistent results. Having a well-defined trading plan helps you stay focused, avoid impulsive decisions, and maintain discipline—especially when emotions run high.
Key elements of a solid trading plan include thorough market analysis, clear trading objectives, and robust risk management rules. Your plan should detail how you’ll approach entering and exiting trades, manage your trading position, and respond to market volatility. Regularly reviewing and updating your trading plan ensures you stay adaptable and continue refining your approach as market conditions evolve.
By sticking to your trading plan, you can minimize losses, maximize profitable trades, and develop a trading style that aligns with your risk tolerance and long-term goals. Remember, consistency and discipline are the foundation of every successful trader’s journey.
Trading Mistakes
Every trader, no matter how experienced, makes mistakes. The key is to recognize them, learn from them, and use those lessons to improve your trading style.
Common trading mistakes include overtrading, neglecting risk management, and chasing minor price movements without a clear strategy. Failing to set stop-loss orders or trading based on emotions rather than analysis can quickly erode your account balance.
To avoid repeating costly errors, keep a detailed trading journal. Record every trade, including your reasoning, the outcome, and what you learned. This habit helps you spot patterns in your behavior, identify areas for improvement, and refine your approach to risk management. Staying disciplined and learning from your mistakes will help you develop a more effective trading style and achieve better results over time.
Remember, even the best traders lose money on some trades. What sets successful day traders apart is their ability to adapt, manage risk, and continuously improve their process.
Trading Community
No trader succeeds in isolation. The trading community is a vibrant network of other traders, analysts, and industry professionals who share knowledge, strategies, and support. By connecting with experienced traders through online forums, social media groups, or trading events, you gain access to valuable market insights, new trading strategies, and a wealth of educational resources.
Engaging with a trading community allows you to exchange ideas, learn from the successes and mistakes of others, and stay updated on the latest market developments. Many traders find motivation and accountability by sharing their progress and challenges with peers who understand the unique pressures of day trading.
Whether you’re seeking guidance from seasoned professionals or collaborating with fellow retail traders, being part of a trading community can accelerate your learning curve and help you achieve your trading goals. Surround yourself with others who are committed to growth, and you’ll find the journey to trading success much more rewarding.
Trading Psychology and Slang
Your mindset is your greatest asset. These terms describe the emotional realities of the market.
- FOMO (Fear Of Missing Out): That anxious feeling you get when a stock is skyrocketing and you aren’t in the trade. FOMO often leads to buying at the absolute top.
- Revenge Trading: Trying to aggressively win back money immediately after taking a painful loss. This usually ends in disaster.
- Paper Trading: Using simulated money to practice buying and selling securities. It’s a great way to test strategies without financial risk.
Your Journey Begins With Understanding
Trading is a tough business. You will face days where you question your strategy and your sanity. But there are also moments of absolute clarity that make you realize all the studying was worth it.
You don’t need to memorize every single term today. Keep this day trading glossary bookmarked. Refer back to it when you hear a new phrase on a trading stream or in a community chat. Consistency comes from discipline, not motivation. Take the time to understand the mechanics, the regulations, and the psychology behind every trade.
Now get off your ass and go get it.