


When I started out in trading, I dived deep into price action & studied every trick in the book. I spent months, no, scratch that, years, marking up my charts.
Then I discovered indicators. I was ecstatic – other traders must know about this stuff, right? I bought this $69.99 indicator that promised to tell me exactly when to buy & sell. Game over. I thought.
But, as it turned out, it was BS. I’d fallen for the trap of thinking more indicators = better decisions. But the conflicting signals just led to paralysis by analysis.
I ditched the indicators and went back to trading from scratch. That’s the essence of price action day trading. Price action trading is considered a ‘pure’ form of TA because it doesn’t rely on second-hand indicators. It can be applied to all sorts of markets, stocks, forex & commodities. Price action trading is all about studying a market’s price history. Not relying on old news.
The 6-Rule Stripped-Down
Trading Framework
Why do we need to leave indicators behind?
These are lagging indicators, just complicated math formulas based on old price data. By the time an indicator flashes a buy signal, the meat of the trade is usually long gone. Price action setups show you what’s coming before an indicator will.
Trading without indicators means we have to focus on what’s happening in the charts right now, not what happened 10 candles ago. It’s a cleaner, more direct way to read market sentiment. You get to see the real-time battle between buyers & sellers right before your eyes.
The building blocks of a clean chart
When you strip away all the noise, what do you have left? You’ve got candlesticks, patterns, charts & market levels. Understanding these elements is what’s gonna take your trading to the next level & give you that elusive market intuition.
Candlestick charts are the best tools for price action traders – they give you a visual guide to price movements & market sentiment. To develop price action trading skills, you need to learn to read these patterns & levels without relying on indicators.
Traders use patterns like inside bars, pin bars, & fake out patterns to make their trading decisions. Backtesting price action strategies is a must-do to see if they actually work & refine your trading rules.
Candlesticks tell a story
Using candlesticks is key to seeing how the price moves. Add some trend lines, see how price behaves at those levels & get a read on the price action & market behavior.
Every single candlestick represents a specific period & shows you the opening, closing, high, & low.
The wicks show the highest & lowest prices reached, while the body shows the opening & closing prices.
We use candlestick patterns like pin bars & engulfing candles to get a feel for market sentiment & what the price might do.
Pay attention to these patterns, see how price moves around them & think about how it’ll affect your trading decisions.
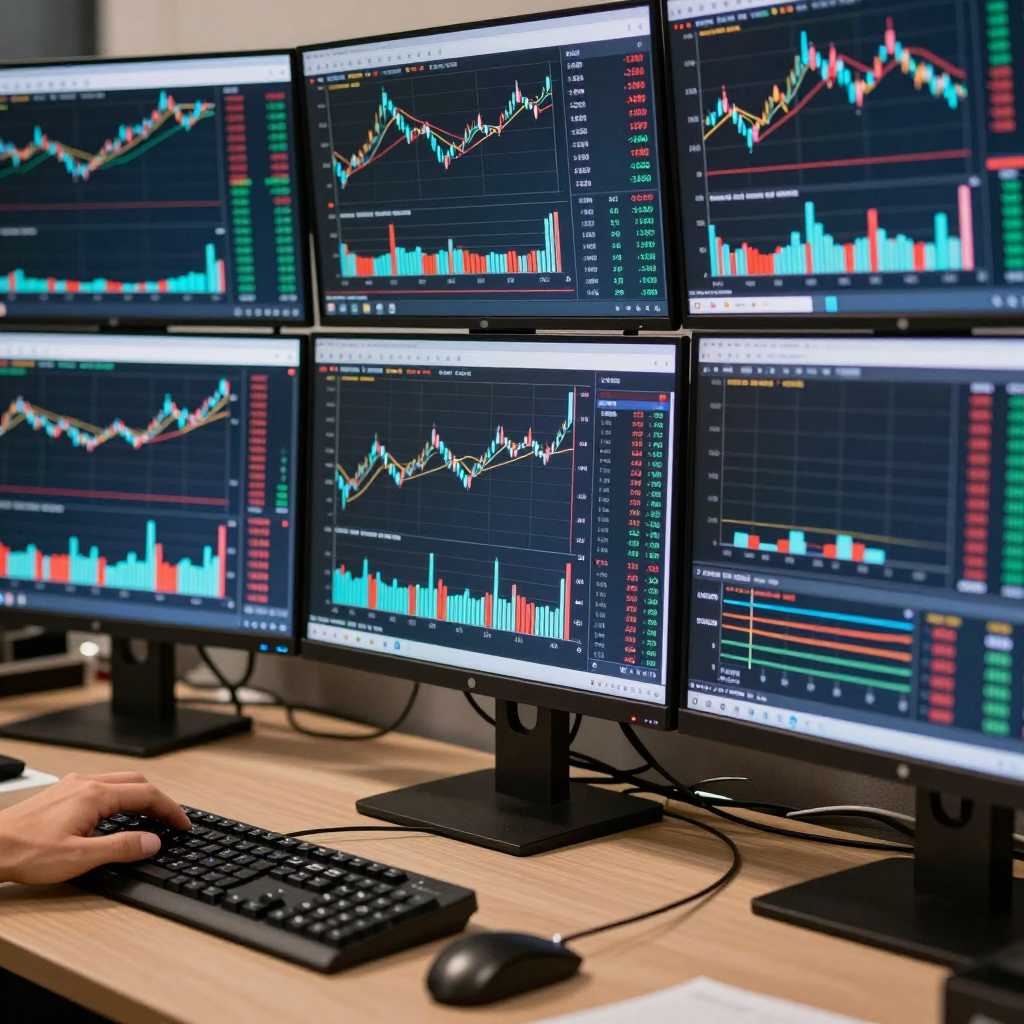
Interpreting price action involves reading these candlestick patterns, but the interpretation can be pretty subjective – different traders can have different views on market sentiment based on the same price movements.
Support & resistance zones
Identifying key price levels is the cornerstone of price action trading. Think of support & resistance as the battlegrounds where buyers & sellers have historically clashed.
Support is where buyers keep pushing price up, resistance is where sellers keep it down. Notice I called them zones, not lines. Price doesn’t usually turn on a dime at an exact price. It’ll push through an area before making a real move.
One of the most reliable things you’ll see is role reversal. This happens when a broken resistance level turns into a new support level. Spotted – that’s a great way to find high-probability trade setups.
When a stock breaks above a resistance level, traders often wait for a retest of that level to confirm the breakout. A successful retest of a previous support or resistance level can confirm the original breakout.
Keep your risk in check

Effective day trading strategies are all about analyzing price action & market volatility. Your long-term survival in the market relies heavily on strict risk management.
When you trade clean charts, you place your stop-loss based on market structure. Indicators like moving averages or volatility measures can help traders identify trends & entry points.
Traders often analyze multiple timeframes to read price action, aligning their trades with the broader market context. Day traders often look at higher timeframes to get a sense of market bias & lower timeframes to pinpoint entry points.
To trade price action effectively, you need to manage risk & adapt to changing market conditions. Your stop-loss should sit at the point where your trade idea is definitively proven wrong. For a long trade, this might be just below a key support zone.
Avoiding common mistakes
Even the most seasoned price action traders can fall into traps that wreck their trading success. One major pitfall is letting yourself get sucked into an over-reliance on lagging indicators again. It’s tempting to let a moving average or oscillator call the shots – but remember: successful price action trading is all about taking in the real-time market price chart, not reacting to signals that are just a record of what’s already gone down.
Over-trading is another trap that catches a lot of traders off guard.
The constant urge to stay in the market can lead you to get into low-quality trades and erode that precious edge you’ve worked so hard for.
You’re better off focusing on high-probability price action set-ups that actually line up with your trading plan.
Patience is the key skill for price action traders – and sometimes the very best trade is the one you don’t make.

A deep understanding of the market’s underlying structure is crucial – you’ve got to spend some quality time studying the market’s past price movements.
Look for the areas where price has bounced or stalled before – those are your strong support and resistance zones. Pay close attention to areas of congestion or consolidation, too – these often precede some big price moves or reversals. Mark those levels on your chart & watch how price behaves when it’s about to hit them.
Trading success is down to discipline and just being open to learning from your mistakes. Stick to observing the market price movement, keep your charts spotless, & be ready to adapt your strategy as the market conditions change.
Your next steps for cleaner price action trading

Learning to read raw price action is just a starting point – it’s gonna take time, patience & a willingness to learn. First thing is to pull up a bare chart. Mark in your major support & resistance zones. Watch what happens when the candlesticks hit those crucial levels.
Seasoned pros use the price chart to figure out what’s going on with price action & spot those high-probability set-ups. Meanwhile, retail traders are also using price action to make informed decisions. So you’re all seeing the same data. Hint: That’s not a good thing.
Pros will often use the daily chart to work out the overall direction of the market & then switch to shorter timeframes for precise entries. Markets that are trending or just stuck in a range require different strategies. You can make your market entries tighter by applying price action analysis across multiple timeframes.
Price action is basically just a record of the collective emotions and decisions of the market.
Learning about price action was the start of my journey, but it was a crucial one. I learned how price behaves & how to spot those patterns. Thing is, lots of pros trade many different ways – so don’t go thinking that price action trading is the be-all & end-all, like some people might lead you to believe.