
Every trader remembers the first time a chart suddenly made sense. Not the numbers, not the indicators—just the price. Moving up, pulling back, bouncing, falling, and then doing it all over again. That moment of clarity? It usually starts with support and resistance. These concepts apply across various financial assets, from stocks to futures, shaping how traders interpret price movement in different markets.
You’ll recognize the floors and ceilings that keep price in check, influencing an asset’s price and overall asset’s direction. You’ll understand why certain levels seem to matter so much to so many traders. Repeated interactions with these levels help shape market sentiment, signaling potential reversals or continuations. This guide breaks it all down—what support and resistance are, how to identify them, and how to actually trade them.
What Is Support and Resistance?
At its core, the market is a tug of war between buyers and sellers. Support and resistance are the price levels where one side consistently wins.

Support is the price level where buyers step in with enough force to stop a decline. These actions typically occur at specific price points, which are strategic levels that traders watch for optimal entry and exit. Think of it as a floor. Price falls, hits a level where demand surges, and bounces back up. Investopedia says that support is where “demand will usually overwhelm supply, causing the price decline to halt and reverse.”
Resistance is the opposite. It’s the ceiling—the price level where sellers show up in force, overwhelming buying pressure and pushing price back down. When a stock approaches resistance, traders who bought higher are looking to break even. New buyers hesitate. The result? Stock price often stalls and reverses at these resistance and support levels, which play a key role in trading decisions.
Here’s the simple version:
- Support = the floor where buyers defend price (resistance support levels are rooted in trader psychology)
- Resistance = the ceiling where sellers push back (these psychological price points influence market behavior)
Why Do These Levels Form?
This is where it gets interesting. Support and resistance aren’t arbitrary lines. They form because of human psychology.
Traders remember price levels. If a stock bounced off $50 three times over six months, that level becomes meaningful. Buyers set alerts there. Sellers plan their exits around it.
Round numbers—$50, $100, $200—carry extra psychological weight simply because people anchor to them. Round numbers tend to attract a large number of buy and sell orders, causing round price levels to act as significant support and resistance zones.
As Investopedia says, “There is nothing magical about these price levels. It is simply that many market participants are acting off the same information and placing trades at similar levels.”
That collective behavior is what creates the zones. Many orders, such as stop-losses and targets, cluster at the same level, reinforcing these support and resistance areas. And the more times price has respected a level, the stronger that level becomes.
Technical traders pay close attention to these psychological and historical levels when planning their trades.
Think in Zones, Not Lines
Here’s a mistake nearly every new trader makes: drawing support and resistance as single, precise lines.
Price doesn’t always turn on a dime. It probes, tests, and occasionally overshoots before reversing.
If you’re too rigid about exact levels, you’ll get stopped out of perfectly good trades.
BabyPips puts it well: “To help you filter out these false breakouts, you should think of support and resistance more as ‘zones’ rather than concrete numbers.“
A zone might span $0.50 to $2.00, depending on the asset’s volatility. The idea is to give the price some room to breathe. Candlestick shadows often “test” a zone without truly breaking it. You’re looking for the market’s intention, not its reflexes.
How to Identify Support and Resistance Levels
There’s no single method, but here are the most reliable approaches: plotting support and resistance on your charts helps visualize key price levels and makes it easier to spot where price may react.
- Look for previous swing highs and lows.
- Identify areas where price has reversed multiple times.
- Use technical tools like moving averages, pivot points, or Fibonacci retracements.
Additionally, analyzing chart patterns—such as triangles, rectangles, or head and shoulders—can help you spot potential support and resistance zones, especially when these patterns signal trend reversals or continuations. Identifying a trading range, where price moves sideways between established support and resistance, allows traders to buy at support and sell at resistance, or prepare for a breakout.
A static support level is a fixed price point identified through historical analysis or tools like pivot points and Fibonacci retracements, and it remains unchanged over time, unlike dynamic support levels that shift with indicators such as moving averages.
Previous Highs and Lows
- Scroll back on your chart. Areas where price previously reversed are your starting points. A prior high becomes a potential resistance level. A prior low becomes potential support. Simple, but effective.
Trendlines
- Connect a series of higher lows in an uptrend, and you get a diagonal support line. Connect lower highs in a downtrend, and you have diagonal resistance. For a trendline to be valid, the price needs to touch it at least three times. The more touches, the stronger the line.
Moving Averages
- Moving averages act as dynamic support and resistance. In an uptrend, price often pulls back to the 50-day or 200-day moving average before continuing higher. Many experienced traders use these as entry zones.
Round Numbers
- Markets have a habit of stalling at $10, $50, $100, $1,000. This isn’t a coincidence—it’s psychology. Large institutional orders, stop losses, and target prices cluster at these levels. Keep an eye on them.
Volume
- A support or resistance zone that formed on high volume carries more weight than one that formed during a quiet session. When lots of traders are active at a price level, that level gets remembered.
Dynamic Support and Resistance
Unlike static support and resistance levels, which are drawn from historical highs, lows, or round numbers, dynamic support and resistance levels shift in real time as new price data comes in.

These levels are most commonly identified using technical indicators that adapt to changing market conditions—think moving averages, Bollinger Bands, or other volatility-based tools.
For example, a 50-period moving average on a price chart can act as a dynamic support level during an uptrend. As the asset’s price moves, the moving average recalculates, providing a constantly updating reference point where buyers might step in.
In futures trading, dynamic support and resistance levels are especially valuable because they help traders react to fast-moving markets and spot potential price breaks or resistance zones as they develop.
Technical indicators like moving averages don’t just provide support and resistance—they also help traders gauge the strength of a trend and anticipate when a price might reverse or accelerate. By watching how price interacts with these dynamic levels, traders can make more informed decisions about entries, exits, and stop placements, adapting their strategies as market conditions evolve.
Pivot Points in Trading
Pivot points are a classic technical indicator used by traders to pinpoint potential support and resistance levels for the current trading session. Calculated from the previous day’s high, low, and close, pivot points project key price levels where the market might find support or encounter resistance. These levels are especially popular in resistance trading, as they often highlight strong price barriers where selling pressure can increase.
Many inexperienced traders tend to cluster their buy and sell orders around pivot points, which can amplify their significance and create noticeable resistance levels or potential support zones. This collective behavior can lead to sharp price reactions when these levels are tested. Pivot points are most effective when used alongside other technical indicators, such as moving averages or trend lines, to confirm the strength of a support or resistance level and refine your trading strategy.
By incorporating pivot points into your analysis, you can better anticipate where price action might stall or reverse, giving you an edge in identifying take profit targets or potential entry points.
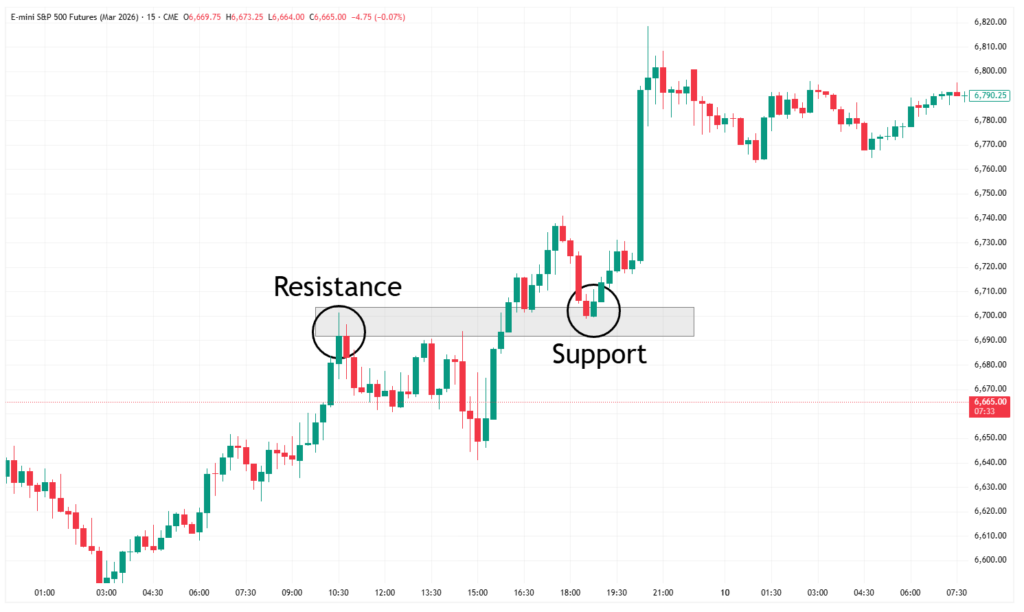
The Role Reversal: When Floors Become Ceilings
This concept trips up a lot of traders. Once you get it, though, it changes how you read charts.
The reverse is also true. When price breaks above resistance, that former resistance can become new support. Buyers who missed the original move will often step in on a pullback to that level.
As BabyPips explains, this is known as “role reversal”—one of the more elegant and reliable concepts in all of technical analysis.
When price breaks through a support level, that former support often becomes new resistance. This event is referred to as ‘broken support,’ and the previous level is called ‘old support.’ Recognizing broken support and old support is important because these changes can signal a potential trend reversal, alerting traders to a shift in market direction.
Traders who bought at that level are now underwater. When price returns to that zone, they’re likely to sell to cut their losses—turning the old floor into a new ceiling.
A real-world example: Exxon Mobil’s $65 price level resisted upward movement twice during 2005–2006. When price finally broke above it in mid-2006, that same $65 zone shifted into a support level. Traders who understood role reversal could anticipate that price pullback and use it as an entry point.
How to Trade Support and Resistance
There are two fundamental approaches: trading the bounce and trading the break.
Support and resistance levels are essential for planning where to enter, where to place your stop, and where to take profits. In addition, these levels help traders determine optimal exit points, allowing for strategic trade management when price approaches key zones.

Bounce trading: This approach involves waiting for price to approach a support or resistance zone, then trading in the opposite direction.
Approaching resistance → look for a short entry. Traders may enter a short position when price approaches resistance areas or resistance lines, anticipating a reversal or pause in upward movement.
Approaching support → look for a long entry. As price approaches these levels, traders monitor for price bounces from strong support, which can signal a move price higher and provide potential buy signals.
The idea is to wait for price to approach a support or resistance zone, then react. Let the market show its hand first. Monitor for price drops at resistance or price bounces at support to confirm the trade setup.
Break trading: This approach involves waiting for price to break through a support or resistance level, then trading in the direction of the breakout. The move that follows can be significant. Price drops or bounces at these levels can indicate the strength of the breakout and help validate the trade. After a breakout, price often returns to the broken level (now reversed in role). Strong support or resistance areas can act as new barriers after a breakout, influencing future price action.
Trading the Bounce
This is the more conservative approach. You wait for price to approach a support or resistance zone, look for confirmation that it’s holding, and then enter in the direction of the bounce.
- Approaching support → look for a long entry
- Approaching resistance → look for a short entry
The keyword is confirmation. Don’t rush in just because price got close to a level. Wait for the candle to close, watch how price reacts, and let the market show its hand first.
Trading the Break
When price breaks through a level with conviction, the move that follows can be significant. There are two ways to approach it:
- Aggressive: Enter immediately when price breaks through the zone
- Conservative: Wait for price to pull back and retest the broken level before entering
The conservative approach is generally safer for new traders. After a breakout, price often returns to the broken level (now reversed in role) before continuing in the new direction. That pullback is your entry.
Advanced Trading Strategies
For traders looking to take their skills to the next level, advanced trading strategies involve layering multiple technical analysis tools to identify support and resistance levels with greater precision.
This might mean combining moving averages, Bollinger Bands, and other volatility-based indicators to spot dynamic support and resistance zones as market conditions shift.
Technical analysis tools like Fibonacci retracement levels and pivot points can help highlight potential price breaks and resistance zones that aren’t always obvious from price action alone.
In range trading, using multiple indicators allows you to identify support and resistance levels that are more likely to hold, improving your odds of catching profitable bounces or breakouts.

By integrating several technical indicators and analysis methods, advanced traders can better identify support and resistance levels, adapt to changing market trends, and fine-tune their trading strategies. This multi-layered approach helps filter out false signals and provides a more comprehensive view of where price might move next.
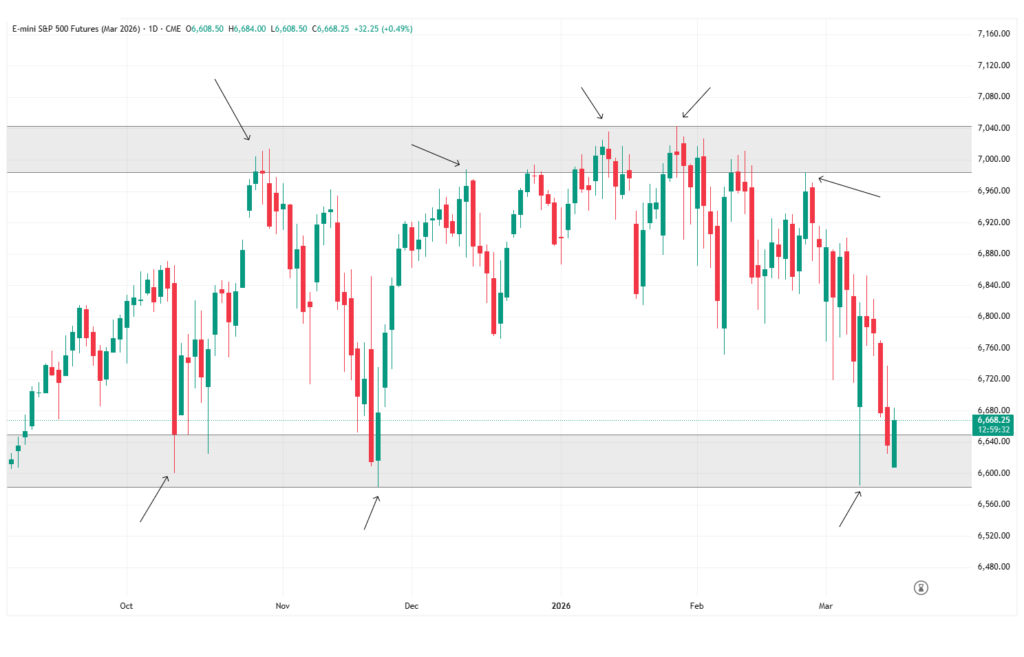
Timeframes Matter
Not all support and resistance levels carry equal weight. Levels identified on weekly or monthly charts are more significant than those on a five-minute chart. Experienced traders pay attention to both.
A practical method: identify key levels on a higher timeframe (daily or weekly), then zoom into a lower timeframe (15-minute or 1-hour) to fine-tune your entry. This is called multi-timeframe analysis, and it dramatically improves trade precision.
Build Your Foundation Here
Support and resistance won’t guarantee profitable trades. Nothing does, and anyone telling you otherwise is selling something. But these levels give your trading a structure—a logical framework for deciding where to enter, where to place your stop, and where to take profits.
There will be days when every level you draw seems to fail. That’s part of the process. The traders who stick around long enough to get good are the ones who keep studying, keep practicing, and never stop refining their approach.
Start with these concepts. Draw your levels. Watch how price interacts with them over days and weeks. Patterns will start to emerge. And then, one day, it’ll click.
Conclusion
Support and resistance levels are the cornerstone of technical analysis, providing traders with a framework to identify potential price breaks, resistance zones, and key decision points. It’s just another tool for the tool box. All these things you’re learning are what will give you an edge in the market.
By understanding support and resistance levels, and leveraging technical indicators like moving averages and pivot points, traders can make more informed decisions and adjust their strategies to fit current market conditions.
Advanced trading strategies, such as range trading and resistance trading, rely on a combination of technical analysis tools to spot potential support and resistance levels and capitalize on price movement. But none of this will matter if youre risk managment isn’t dialed in.
By combining technical analysis tools, sound risk management, and a disciplined trading strategy, you can increase your chances of success in the financial markets. Keep refining your approach, stay adaptable, and remember: the more you practice identifying support and resistance levels, the more intuitive your trading decisions will become.
Risk disclosure: Trading involves substantial risk of loss and is not suitable for all investors. Past chart behavior does not guarantee future results. Trade only with capital you can afford to lose.